Felix de Moya Anegon.
Research is not the only activity carried out at universities, but we know Higher Education Institutions’ (HEIs) ability to generate scientific knowledge is an obvious symptom of general performance. The existence of renowned researchers in universities is not by itself a sign of global quality, however nowadays it is hard to think about advanced human capital training unconnected to high quality knowledge generation processes.
In this regard, bibliometric indicators measuring the average quality of HEIs research outputs are valuable reference marks of research capability when it comes time to disseminate the acquired knowledge and spread it to the students. For this reason, it makes sense to put HEIs through benchmarking processes using the Normalized Impacts (NI)* reached by its research outputs. And it will make sense as well to compare the impact distributions of National Higher Education Systems to assess aspects such as the level of heterogeneity of universities within a country or its compared average level, so that policymakers consider whether is better to sacrifice homogeneity to promote top-class institutions, or otherwise the excellence can be reached for the system itself without having to give up equity.
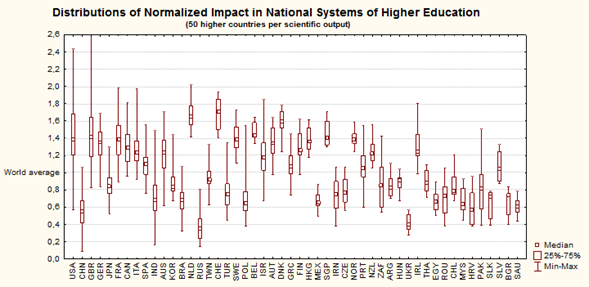
The following chart generated from the World Report SIR 2010 (based on Scopus data) shows, in a comparative way, the Normalized Impact Distributions for all the universities belonging to the world’s 50 most productive countries on scientific knowledge.

Universities within countries are distributed in quartiles ranging form higher to lower NI. As can be seen on the chart, the 50 countries can be divided into two groups: on one hand, those which have more than 75% of its universities over the world average and; on the other, those which have the same percentage underneath. We find 24 countries in the first group featuring USA, UK, Germany, France, Canada, Italy and Spain and 26 in the second one including China, Japan, Korea, India, Brazil and Russia.
It might be surprising the presence of Japan or Korea in the second group, but it is not. We must consider that NI distributions show the average value of the international visibility reached by universities research outputs in those countries. Therefore the fact of being technologically developed countries is not incompatible with the relatively low research visibility showed by its academic institutions. The reasons for this are varied and this may not be the place to deal with them, but it can be pointed out briefly that according to the SIR World Report 2010 while one can easily find large Japanese and Korean Companies carrying out high-profile research amongst the world’s Top 100 ordered by NI (i.e. Toyota, Nippon, Samsung, Toshiba, Fujitsu, Hitachi and Mitsubishi) it is otherwise hard to find a Japanese or Korean university in the same ranking Top 400.
It also worth analyzing the level of homogeneity shown by different National Higher Education Systems. The chart shows some countries having similar NI values for all their universities, these countries, which belong either to the first or second before-mentioned groups, show small differences between extreme NI values, i.e. Belgium and Ukrania. On the contrary, the most heterogeneous countries, from an NI perspective, are those whose universities manage to reach very high impact rates jointly coexisting with other ones presenting very low NI rates. This phenomena is not only related to the size or complexity of educational systems, but also to Public vs. Private balance and the level of openness to the globalized market of the different National Higher Education Systems.
To conclude I would mention that the systems’ ability to attract talent is one of the most supporting factors in rising research reputation and, attached to it, the scientific visibility reached by universities around the world.
* Normalized Impact scores indicate the scientific impact that institutions have over the scientific community. In order to obtain a fair measurement of such impact, its calculation removes the influence due to institutions’ size and research profile making it ideal for comparing research performance. [More]